ISO 9001:2015 ISO/IEC 27001:2022
Left Logo
Middle Logo

Certificate in Data Analytics Using Power BI

What is Data Analytics using Power BI?

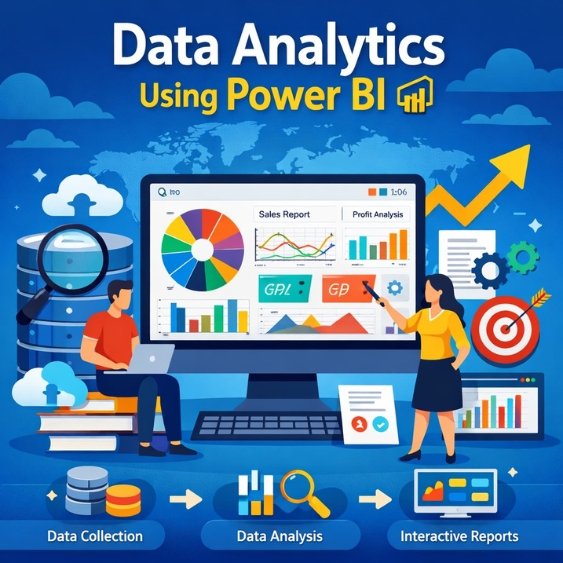
Data analytics using Power BI is the process of collecting, cleaning, analyzing, and visualizing data to make informed business decisions. Power BI transforms raw data into interactive dashboards and reports. Over 97% of Fortune 500 companies use Microsoft cloud tools for analytics and reporting.

Why should you learn this course?

The global data analytics market is projected to exceed $650 billion by 2030. Power BI skills are in high demand, with data-related jobs growing 30–35% annually. Learning this course improves decision-making ability, salary potential, and career opportunities across industries.

Who can join this course program?

Students, graduates, accountants, business owners, IT professionals, and working executives can join. No advanced coding is required. Anyone with basic computer knowledge and interest in data-driven decision-making can start. Analytics roles are among the top 10 fastest-growing careers globally.

🚀 Global data analytics jobs are projected to grow ~28–35% by 2030, outpacing average jobs. Over 2.7 million openings exist worldwide, and demand for analytics skills remains strong across major markets.
Course

Certificate in Data Analytics Using Power BI

Course Duration: 12 Months

Eligibility: 10+2 (Science & Commerce)

Admission Now

Course Syllabus Details

➥ Course Overview

           ↪ What is Data Analytics?

           ↪ Role & Responsibilities of a Data Analyst

           ↪ What Data Analysts Actually Do

           ↪ Data Analytics Workflow

           ↪ Tools Used by Data Analysts

➥ Business Understanding

           ↪ Understanding Business Problems

           ↪ Turning Problems into Data Questions

           ↪ Basic Analysis & Insights

➥ Mini Project

           ↪ The Profitable Car Showroom

➥ Introduction to Excel

           ↪ Excel Interface Walkthrough

           ↪ Workbooks & Worksheets

           ↪ Saving & Opening Workbooks

           ↪ Adding Data with Headers

➥ Formatting & Basics

           ↪ Cell Alignment, Fonts & Colors

           ↪ Cell Formatting

           ↪ Order of Operations

           ↪ Absolute & Relative References

➥ Calculations & Functions

           ↪ Performing Calculations

           ↪ Excel Formulas

           ↪ Functions in Excel

           ↪ Commonly Used Functions

➥ Data Handling

           ↪ Modifying Worksheets

           ↪ Formatting Data

           ↪ Conditional Formatting

           ↪ Sorting & Filtering

           ↪ Generating Random Data

➥ Charts & Visualization

           ↪ Charts in Excel

           ↪ Images & Shapes

           ↪ Print Preview & Printing

           ↪ Templates in Excel

           ↪ Referencing Data Across Worksheets

➥ Mini Project

           ↪ Expense Tracker using Excel

➥ Advanced Formulas

➥ Lookup Functions (VLOOKUP, HLOOKUP, XLOOKUP, INDEX-MATCH)

➥ Pivot Tables

➥ Pivot Charts

➥ Advanced Conditional Formatting

➥ Data Validation

➥ Excel Dashboards

➥ Setup & Environment

           ↪ Introduction to AI-powered Python

           ↪ Installing Python & VS Code

           ↪ Installing Packages using pip

           ↪ Built-in vs External Packages

➥ Core Concepts

           ↪ Variables & Data Types

           ↪ Comments & Type Conversion

           ↪ User Input

           ↪ Operators

           ↪ Strings & String Methods

           ↪ f-strings

➥ Data Structures

           ↪ Lists

           ↪ Tuples

           ↪ Sets

           ↪ Dictionaries

➥ Programming Logic

           ↪ Conditional Statements

           ↪ Loops

           ↪ Functions

           ↪ Local vs Global Variables

➥ File & Error Handling

           ↪ File Handling

           ↪ Error & Exception Handling

➥ Mini Projects

➥ Introduction to AI-Assisted Coding

➥ ChatGPT Setup & Best Practices

➥ Using GitHub Copilot

➥ AI Tools for Productivity

➥ AI Tools for Data Cleaning

➥ AI Tools for Analysis & Reporting

➥ AI Tools for Visualization

➥ Automating Repetitive Tasks

➥ Becoming a “10× Faster Analyst”

➥ NumPy

           ↪ Arrays

           ↪ Indexing

           ↪ Mathematical Operations

➥ Pandas

           ↪ Series & DataFrames

           ↪ Data Cleaning

           ↪ Handling Missing Values

           ↪ GroupBy & Aggregation

➥ Data Visualization

           ↪ Matplotlib (Line, Bar, Pie, Histogram)

           ↪ Seaborn (Heatmaps, Distribution Plots, Statistical Graphs)

➥ Database Basics

           ↪ Introduction to Databases

           ↪ Installing & Setting up SQL

           ↪ Creating Databases & Tables

           ↪ Insert, Update, Delete Records

➥ Data Querying

           ↪ SELECT Statements

           ↪ WHERE, ORDER BY

           ↪ GROUP BY & HAVING

           ↪ Aggregate Functions

           ↪ Joins

           ↪ Subqueries

           ↪ Views

➥ Introduction to Statistics

➥ Types of Data

➥ Measures of Central Tendency

➥ Measures of Dispersion

➥ Probability Basics

➥ Normal Distribution

➥ Correlation & Covariance

➥ Business Interpretation of Statistics

➥ Principles of Data Visualization

➥ Choosing the Right Chart

➥ Storytelling with Data

➥ Dashboard Design Best Practices

➥ Fundamentals

           ↪ Introduction to Power BI

           ↪ Power BI Interface

           ↪ Importing Data

           ↪ Data Transformation (Power Query)

➥ Data Modeling

           ↪ Relationships

           ↪ DAX Basics

           ↪ Calculated Columns & Measures

➥ Reporting

           ↪ Creating Reports

           ↪ Interactive Dashboards

           ↪ Filters & Slicers

           ↪ Drill-through & Tooltips

➥ Deployment

           ↪ Publishing to Power BI Service

           ↪ Sharing Reports

           ↪ Workspace Management

➥ Introduction to Tableau

➥ Connecting Data Sources

➥ Building Visualizations

➥ Calculated Fields

➥ Dashboards & Stories

➥ Git & GitHub

           ↪ Version Control Basics

           ↪ Git Workflow

           ↪ GitHub Repositories

           ↪ Collaboration using GitHub

➥ Web Concepts

           ↪ UI Basics

           ↪ Web Dashboards

           ↪ Introduction to Web-based Visualization

           ↪ Dashboard Deployment Concepts

➥ Machine Learning Fundamentals

           ↪ What is Machine Learning

           ↪ ML vs Data Analytics

           ↪ Supervised vs Unsupervised Learning

           ↪ Use Cases for Analysts

➥ Core ML Algorithms

           ↪ Linear Regression

           ↪ Logistic Regression

           ↪ K-Means Clustering

           ↪ Decision Trees

           ↪ Model Evaluation Basics

➥ ML Libraries

           ↪ scikit-learn

           ↪ Pandas & NumPy Revision

           ↪ ML Visualization

➥ Cloud Fundamentals

           ↪ What is Cloud Computing

           ↪ IaaS, PaaS, SaaS

           ↪ AWS / Azure / GCP Overview

           ↪ Cloud Storage Concepts

           ↪ Google Colab

➥ Business Problem Understanding

➥ Data Collection

➥ Data Cleaning & Preprocessing

➥ Analysis using Excel / Python / SQL

➥ Visualization using Power BI / Tableau

➥ Dashboard Creation

➥ Final Business Report

➥ Presentation & Viva

Job Prospects

⫸   Data Analyst

⫸   Business Intelligence (BI) Analyst

⫸   Power BI Developer

⫸   Tableau Developer

⫸   Excel Data Analyst

⫸   SQL Developer

⫸   Database Analyst

⫸   Python Data Analyst

⫸   Reporting Analyst

⫸   MIS Executive

⫸   Business Analyst

⫸   Data Visualization Specialist

⫸   Junior Data Scientist

⫸   Machine Learning Analyst

⫸   Financial Data Analyst

⫸   Operations Analyst

⫸   Dashboard & Insights Consultant


Market Trending

✅   There are ~4.5 million data science & analytics job openings globally, with the U.S. making up ~35% and India ~1.2 million roles. Demand is rising across Europe, China, Australia, and SEA


✅   Data analytics jobs are projected to grow 23–35% by 2032–34, much faster than average occupations


✅   The global data analysis market was valued at $45.3 billion in 2022 and is expanding rapidly worldwide.


✅   In the U.S., median salaries for data scientists are about $112,590/year, with strong demand through 2034.


✅   Countries like the U.S., UK, Canada, Australia, and Singapore offer some of the highest data analytics salary ranges, reflecting global skill demand.


✅   43% of global companies struggle to find qualified analytics talent, underscoring strong career opportunities.

Tools Covered

Logo 1
Logo 2
Logo 3
Logo 4
Logo 5
Logo 6
Logo 7
Logo 8
Logo 9
Logo 10
Logo 11
Logo 12
Logo 13
Logo 14
Logo 15
Logo 16

Why Choose SAHFAR Academy?

  • Industry-Relevant Curriculum
  • Experienced Trainers
  • 100% Practical Training
  • Internship Opportunities
  • Placement Assistance
  • Affordable Fee Structure
  • Live Project Exposure

Get Industry Related Certification

Certification

SAHFAR Academy Certification

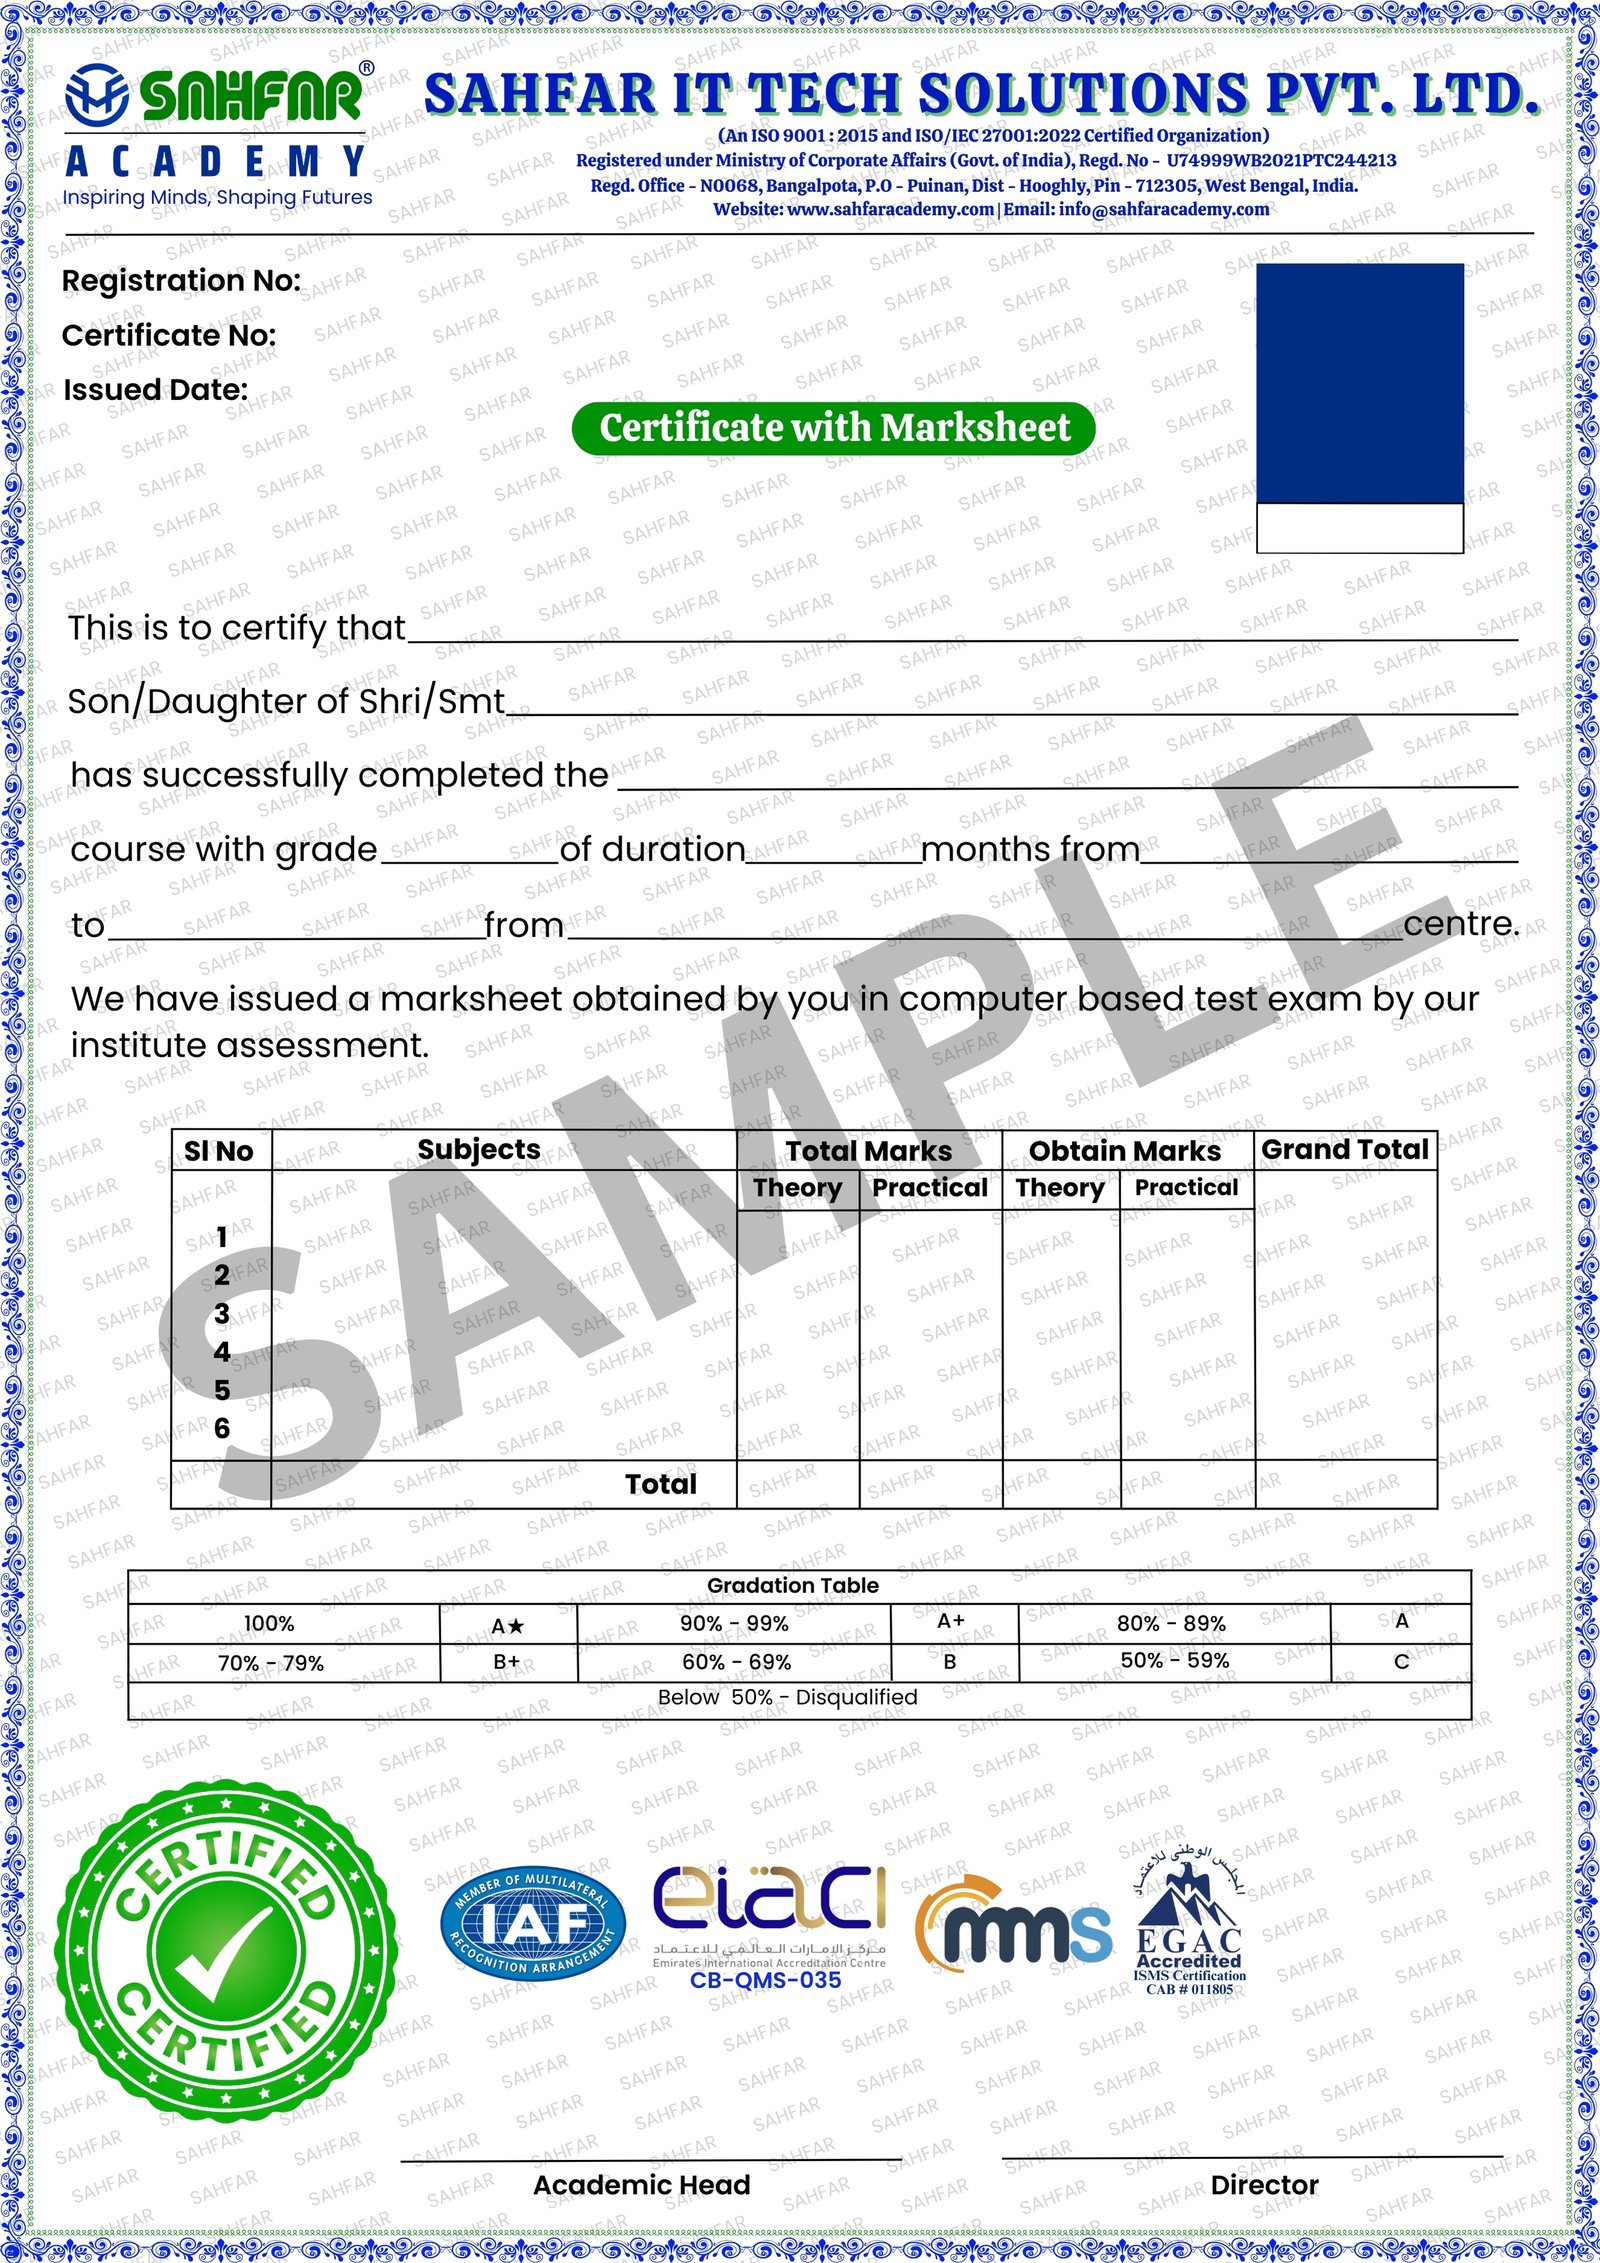
The SAHFAR ACADEMY Certification is designed to validate your skills with a perfect blend of practical training and theoretical knowledge. Our curriculum is aligned with real-world demands and reviewed by industry experts.

    This certification is recognized by companies across India, making it a trusted mark of your capability. It reflects your readiness to take on professional challenges with confidence and clarity.

    Whether you're starting your career or upskilling for better opportunities, our industry-graded certification ensures your learning meets professional standards and is accepted by leading startups, MSMEs, and corporate houses.

  • Recognized by Industry Experts
  • Adds Value to Resume
  • Skill-Based Assessment
  • Proof of Course Completion
  • Digital & Printable Format
  • Career Accelerator

Get in Touch with Us

Book a Career Counselling Call FREE (Worth ₹999)

Contact Us

Student Reviews

“I joined with zero analytics background, but the trainers at SAHFAR Academy explained everything clearly. Now I confidently build dashboards in Power BI.”

Student 1

Biplab Das

Freelancer & Entrepreneur

“This course helped me switch careers from accounting to data analytics. The real projects and hands-on practice made learning enjoyable and effective.”

Student 2

Priya Das

Freelancer

“SAHFAR Academy supported me every step — from Excel basics to Python and SQL. The lessons are practical, relevant, and easy to follow.”

Student 3

Amit Roy

Digital Marketing Job

“I loved the interactive classes and real business problems. After this course, I’m now prepared for interviews and real analyst roles.”

Student 4

Misba Ul Islam

Digital Marketing Job

“Power BI and Tableau sessions were eye-opening! The instructors were patient, supportive, and always ready to help us grow.”

Student 5

Anirban Ghosh

Businessman

“This course didn’t just teach tools — it taught how to think like a data analyst. I feel confident using analytics in my job and future career.”

Student 6

Surajit Paul

Entrepreneur

Any Doubts? Let’s Clear

This course is for anyone — students, job seekers, working professionals, and business owners — who wants to transform data confusion into clarity, confidence, and career success.
Not at all. Even if you’ve never opened Excel before, our step-by-step training ensures you grow from basics to advanced data analytics smoothly.
You’ll master Excel, Power BI, SQL, Python, Tableau, visualization, statistics, and real project experience — turning data into insights employers value.
Yes — our learners secure roles as Data Analysts, BI Developers, and Reporting Specialists because the training focuses on real tools and real business problems.
You’ll get practical, live-oriented lessons, hands-on projects, and mentorship that feels personal — like a guide helping you succeed every step.
Absolutely. The flexible structure lets you balance learning with life — and every session adds confidence, not stress.
We care about your growth — not just certificates. Trainers take time to explain, support your doubts, and push you toward real results.
You’re not alone. Our support team and mentors walk you through challenges — students often say, “They believed in me even when I doubted myself.”